Hi. I'm Waving hand animated gif AKILESH S

Currently, I am working as a Development Engineer in Comcast CIEC, within the Streaming Broadcasting and Advertising (SB&A) Department under the Professional Services team. I earned a Bachelor's degree in Computer Science and Engineering with a specialization in Data Science from Kalasalingam University, Tamil Nadu.

I am having hands-on experience in Java, Python, Groovy, SQL, Git and Github, AWS, Concourse and Data Science-related tools like Tableau and POWER BI. I have a Strong ability to learn and grasp new Technologies. I regularly update on GitHub and ask me about any Tech-related stuff.

Connect With me

Akilesh--S AkileshSaravanan akilesh23 akilesh_lays AKILESH_RMS Akilesh_RMS

Learn About What I Done

Here’s some list of my Projects I Done.

Collaborative Recommendation System For Gadgets

I have done various recommender systems by using User-Id, Product-Id, and Rating attributes and I recommend the best products to customers by ratings of the customers.

GitHub Link

Student Mental Issues Visualization Using Plotly

I surveyed and collected data from our friends, Relations, Faculty, and Students, Based on the survey I did various Data Visualization plots using Plotly and got I output on how the Students are getting mental issues.

GitHub Link

Linkedin Data Analysis

As an active user on LinkedIn with more than 1000 connections, I was curious about the statistics of my network.In this project, I will go through how I utilized exploratory analysis and data visualizations to answer these questions and gain insights from my own LinkedIn data.

GitHub Link

Analysis Of Traffic Congestion Using Hadoop

The Project solution utilizes spatial and temporal correlations, incorporating neighboring road traffic data through the KNN algorithm to predict traffic congestion, resulting in a two-fold improvement in accuracy compared to existing methods using Hadoop.

GitHub Link

Richter's Predictor Modeling Earthquake Damage

We predict the Damage level to the buildings,organizations,Houses and Apartments by considering the main attributes like Magnitude level,latitude and longitude.We use to predict the level by using the algorithms like Desicion tree and Random forest using python.

GitHub Link

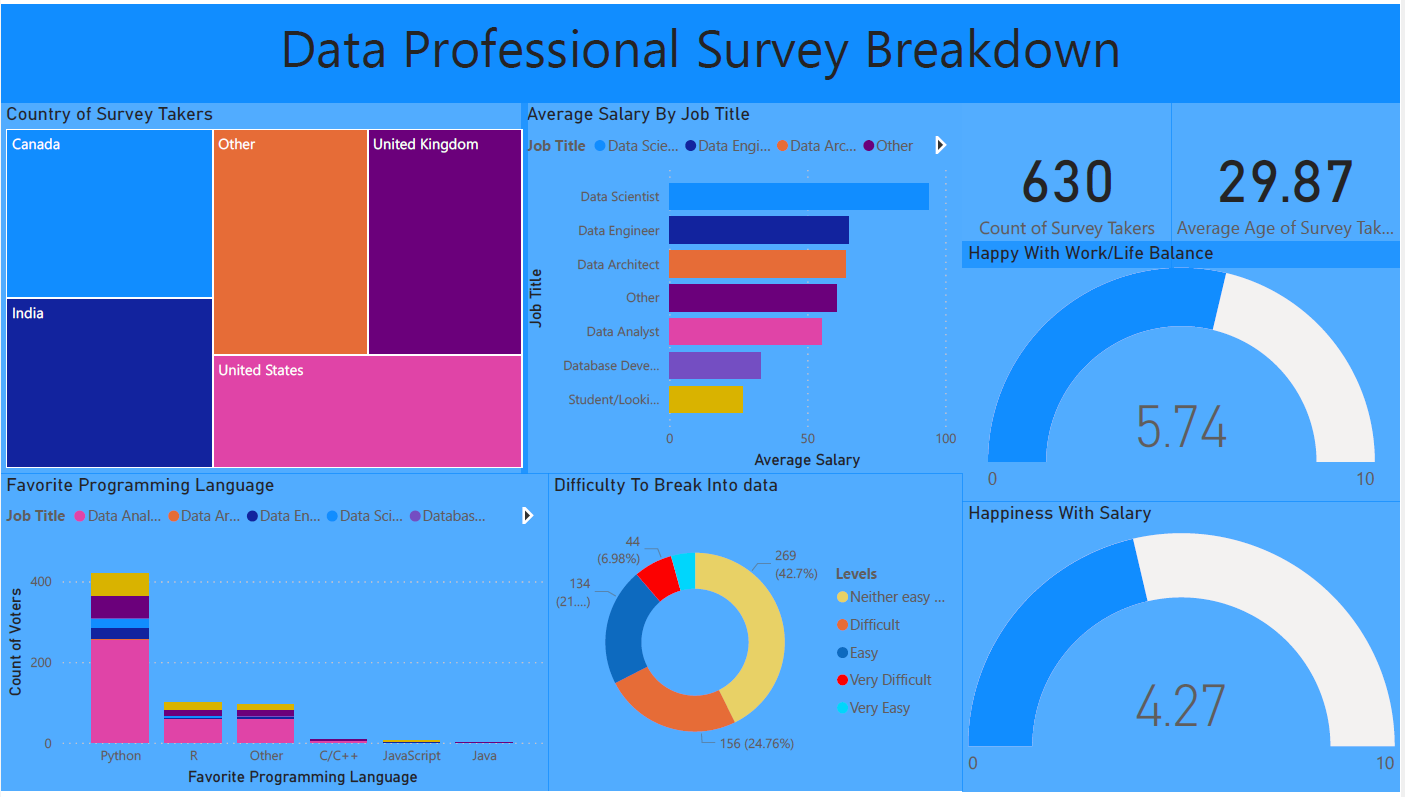
Power-BI and Dashboard on "Data Professional Survey Breakdown"

The Project contains codes and visualization of different charts on POWER BI, I started from scratch and advanced my skills in Power BI by practicing various operations, visualizations, and creating dashboards on POWER BI.

GitHub Link

Feel Free 😁 To Connect With Me.

E-Mail πŸ“§: rmsakilesh23@gmail.com

Location πŸ“: Tamil Nadu, India

Find me on ...